| Carbon Dioxide |
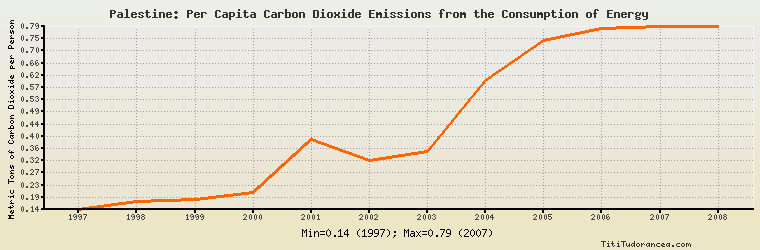
Palestine: Per Capita Carbon Dioxide Emissions from the Consumption of Energy
Metric Tons of Carbon Dioxide per Person
| Year | Palestine | Change, percent | Palestine, percent of Middle East | Palestine, percent of World |
| 1980 | N/A | N/A | N/A | N/A |
| 1981 | N/A | N/A | N/A | N/A |
| 1982 | N/A | N/A | N/A | N/A |
| 1983 | N/A | N/A | N/A | N/A |
| 1984 | N/A | N/A | N/A | N/A |
| 1985 | N/A | N/A | N/A | N/A |
| 1986 | N/A | N/A | N/A | N/A |
| 1987 | N/A | N/A | N/A | N/A |
| 1988 | N/A | N/A | N/A | N/A |
| 1989 | N/A | N/A | N/A | N/A |
| 1990 | N/A | N/A | N/A | N/A |
| 1991 | N/A | N/A | N/A | N/A |
| 1992 | N/A | N/A | N/A | N/A |
| 1993 | N/A | N/A | N/A | N/A |
| 1994 | N/A | N/A | N/A | N/A |
| 1995 | N/A | N/A | N/A | N/A |
| 1996 | N/A | N/A | N/A | N/A |
| 1997 | 0.143 | N/A | 14.300% | 3.617% |
| 1998 | 0.172 | 20.280% | 17.200% | 4.420% |
| 1999 | 0.177 | 2.907% | 17.700% | 4.547% |
| 2000 | 0.202 | 14.124% | 20.200% | 5.148% |
| 2001 | 0.390 | 93.069% | 39.000% | 9.997% |
| 2002 | 0.317 | -18.718% | 31.700% | 7.987% |
| 2003 | 0.347 | 9.464% | 34.700% | 8.433% |
| 2004 | 0.599 | 72.622% | 59.900% | 13.850% |
| 2005 | 0.738 | 23.205% | 73.800% | 16.750% |
| 2006 | 0.781 | 5.827% | 78.100% | 17.582% |
| 2007 | 0.788 | 0.896% | 78.800% | 17.445% |
| 2008 | 0.787 | -0.127% | 78.700% | 17.335% |
| 2009 | N/A | N/A | N/A | N/A |
| 2010 | N/A | N/A | N/A | N/A |
Historical Energy Data about Palestine
Total Consumption of Petroleum Products
Oil and Petroleum Products, Net Exports/Imports (-)
Dry Natural Gas, Net Exports/Imports (-)
Total Coal Consumption
Coal, Net Exports/Imports (-)
Total Electricity Net Generation
Total Electricity Net Consumption
Total Electricity Imports
Electricity, Net Exports/Imports (-)
Total Conventional Thermal Electricity Net Generation
Total Primary Energy Consumption
Total Carbon Dioxide Emissions from the Consumption of Energy
Population
YOU MAY ALSO LIKE
 If you own or manage a business, you can create a web page for free on Titi Tudorancea Business Info. » |