| Carbon Dioxide |
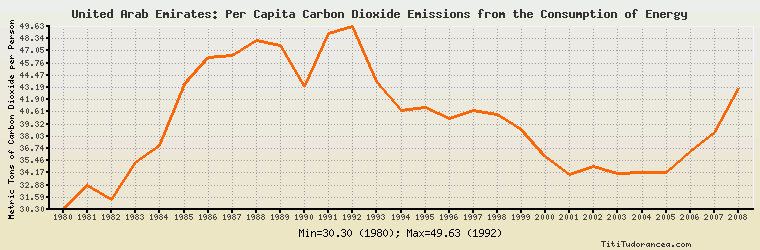
United Arab Emirates: Per Capita Carbon Dioxide Emissions from the Consumption of Energy
Metric Tons of Carbon Dioxide per Person
| Year | United Arab Emirates | Change, percent | United Arab Emirates, percent of Middle East | United Arab Emirates, percent of World |
| 1980 | 30.303 | N/A | 3,030.300% | 729.665% |
| 1981 | 32.819 | 8.303% | 3,281.900% | 813.761% |
| 1982 | 31.398 | -4.330% | 3,139.800% | 797.106% |
| 1983 | 35.314 | 12.472% | 3,531.400% | 905.719% |
| 1984 | 37.030 | 4.859% | 3,703.000% | 921.373% |
| 1985 | 43.497 | 17.464% | 4,349.700% | 1,076.126% |
| 1986 | 46.375 | 6.617% | 4,637.500% | 1,141.117% |
| 1987 | 46.548 | 0.373% | 4,654.800% | 1,135.871% |
| 1988 | 48.202 | 3.553% | 4,820.200% | 1,158.145% |
| 1989 | 47.581 | -1.288% | 4,758.100% | 1,146.254% |
| 1990 | 43.302 | -8.993% | 4,330.200% | 1,055.117% |
| 1991 | 48.844 | 12.798% | 4,884.400% | 1,215.025% |
| 1992 | 49.628 | 1.605% | 4,962.800% | 1,259.274% |
| 1993 | 43.857 | -11.629% | 4,385.700% | 1,117.091% |
| 1994 | 40.708 | -7.180% | 4,070.800% | 1,044.598% |
| 1995 | 41.064 | 0.875% | 4,106.400% | 1,052.114% |
| 1996 | 39.893 | -2.852% | 3,989.300% | 1,013.542% |
| 1997 | 40.809 | 2.296% | 4,080.900% | 1,032.094% |
| 1998 | 40.310 | -1.223% | 4,031.000% | 1,035.980% |
| 1999 | 38.739 | -3.897% | 3,873.900% | 995.094% |
| 2000 | 35.946 | -7.210% | 3,594.600% | 916.055% |
| 2001 | 34.049 | -5.277% | 3,404.900% | 872.827% |
| 2002 | 34.796 | 2.194% | 3,479.600% | 876.694% |
| 2003 | 34.071 | -2.084% | 3,407.100% | 827.971% |
| 2004 | 34.167 | 0.282% | 3,416.700% | 789.988% |
| 2005 | 34.208 | 0.120% | 3,420.800% | 776.396% |
| 2006 | 36.411 | 6.440% | 3,641.100% | 819.698% |
| 2007 | 38.461 | 5.630% | 3,846.100% | 851.472% |
| 2008 | 43.105 | 12.075% | 4,310.500% | 949.449% |
| 2009 | N/A | N/A | N/A | N/A |
| 2010 | N/A | N/A | N/A | N/A |
Historical Energy Data about United Arab Emirates
Total Oil Supply
Total Consumption of Petroleum Products
Oil and Petroleum Products, Net Exports/Imports (-)
Production of Crude Oil including Lease Condensate
Crude Oil Proved Reserves
Dry Natural Gas Production
Dry Natural Gas Consumption
Dry Natural Gas, Net Exports/Imports (-)
Proved Reserves of Natural Gas
Coal, Net Exports/Imports (-)
Total Electricity Net Generation
Total Electricity Net Consumption
Electricity, Net Exports/Imports (-)
Total Conventional Thermal Electricity Net Generation
Total Primary Energy Production
Total Primary Energy Consumption
Total Carbon Dioxide Emissions from the Consumption of Energy
Population
YOU MAY ALSO LIKE
 If you own or manage a business, you can create a web page for free on Titi Tudorancea Business Info. » |